library(here)      # manage file paths
library(socviz)    # data and some useful functions
library(tidyverse) # your friend and mine
library(targets) # pipelinesExample 11: A pipeline
Load our packages
A scratch project
A targets project has two parts: a script, _targets.R, that defines the pipeline, and a data store, _targets/, where the results are kept. Normally both live at the top of your project folder. Here we put them in a temporary directory, so as not to break this website.
pipeline_dir <- fs::dir_create(fs::path_temp("organ_pipeline"))
pipeline_script <- fs::path(pipeline_dir, "_targets.R")
pipeline_store <- fs::path(pipeline_dir, "_targets")
Write the pipeline
tar_script() writes its contents to a _targets.R file. The pipeline takes the organdata data, drops missing values, summarizes donor rates by country, fits a model, and draws a figure. Each step is a target.
tar_script(
  {
    library(targets)
    tar_option_set(packages = c("dplyr", "ggplot2", "socviz"))

    list(
      tar_target(organ_raw, organdata),
      tar_target(
        organ_clean,
        organ_raw |>
          filter(!is.na(donors), !is.na(gdp))
      ),
      tar_target(
        donor_summary,
        organ_clean |>
          summarize(
            mean_donors = mean(donors),
            sd_donors = sd(donors),
            .by = c(country, consent_law)
          )
      ),
      tar_target(
        donor_model,
        lm(donors ~ gdp + consent_law, data = organ_clean)
      ),
      tar_target(
        donor_plot,
        ggplot(
          donor_summary,
          aes(
            x = mean_donors,
            y = reorder(country, mean_donors),
            color = consent_law
          )
        ) +
          geom_pointrange(
            aes(
              xmin = mean_donors - sd_donors,
              xmax = mean_donors + sd_donors
            )
          ) +
          labs(
            x = "Donors per million population",
            y = NULL,
            color = "Consent law"
          )
      )
    )
  },
  script = pipeline_script,
  ask = FALSE
)
What’s in the pipeline?
tar_manifest() lists the targets and the command for each one.
tar_manifest(script = pipeline_script) |>
  select(name)
# A tibble: 5 × 1
name
<chr>
1 organ_raw
2 organ_clean
3 donor_model
4 donor_summary
5 donor_plot Run it
tar_make() runs every target that is out of date. The first time through, that’s all of them.
tar_make(script = pipeline_script, store = pipeline_store)+ organ_raw dispatched
✔ organ_raw completed [122ms, 10.99 kB]
+ organ_clean dispatched
✔ organ_clean completed [2ms, 9.97 kB]
+ donor_model dispatched
✔ donor_model completed [1ms, 19.84 kB]
+ donor_summary dispatched
✔ donor_summary completed [2ms, 599 B]
+ donor_plot dispatched
✔ donor_plot completed [8ms, 109.11 kB]
✔ ended pipeline [290ms, 5 completed, 0 skipped]Read the results
Results are stored on disk. tar_read() fetches them.
tar_read(donor_model, store = pipeline_store) |>
  broom::tidy()
# A tibble: 3 × 5
term estimate std.error statistic p.value
<chr> <dbl> <dbl> <dbl> <dbl>
1 (Intercept) 16.9 1.83 9.20 4.76e-17
2 gdp -0.0000908 0.0000745 -1.22 2.24e- 1
3 consent_lawPresumed 3.30 0.679 4.86 2.36e- 6tar_read(donor_plot, store = pipeline_store)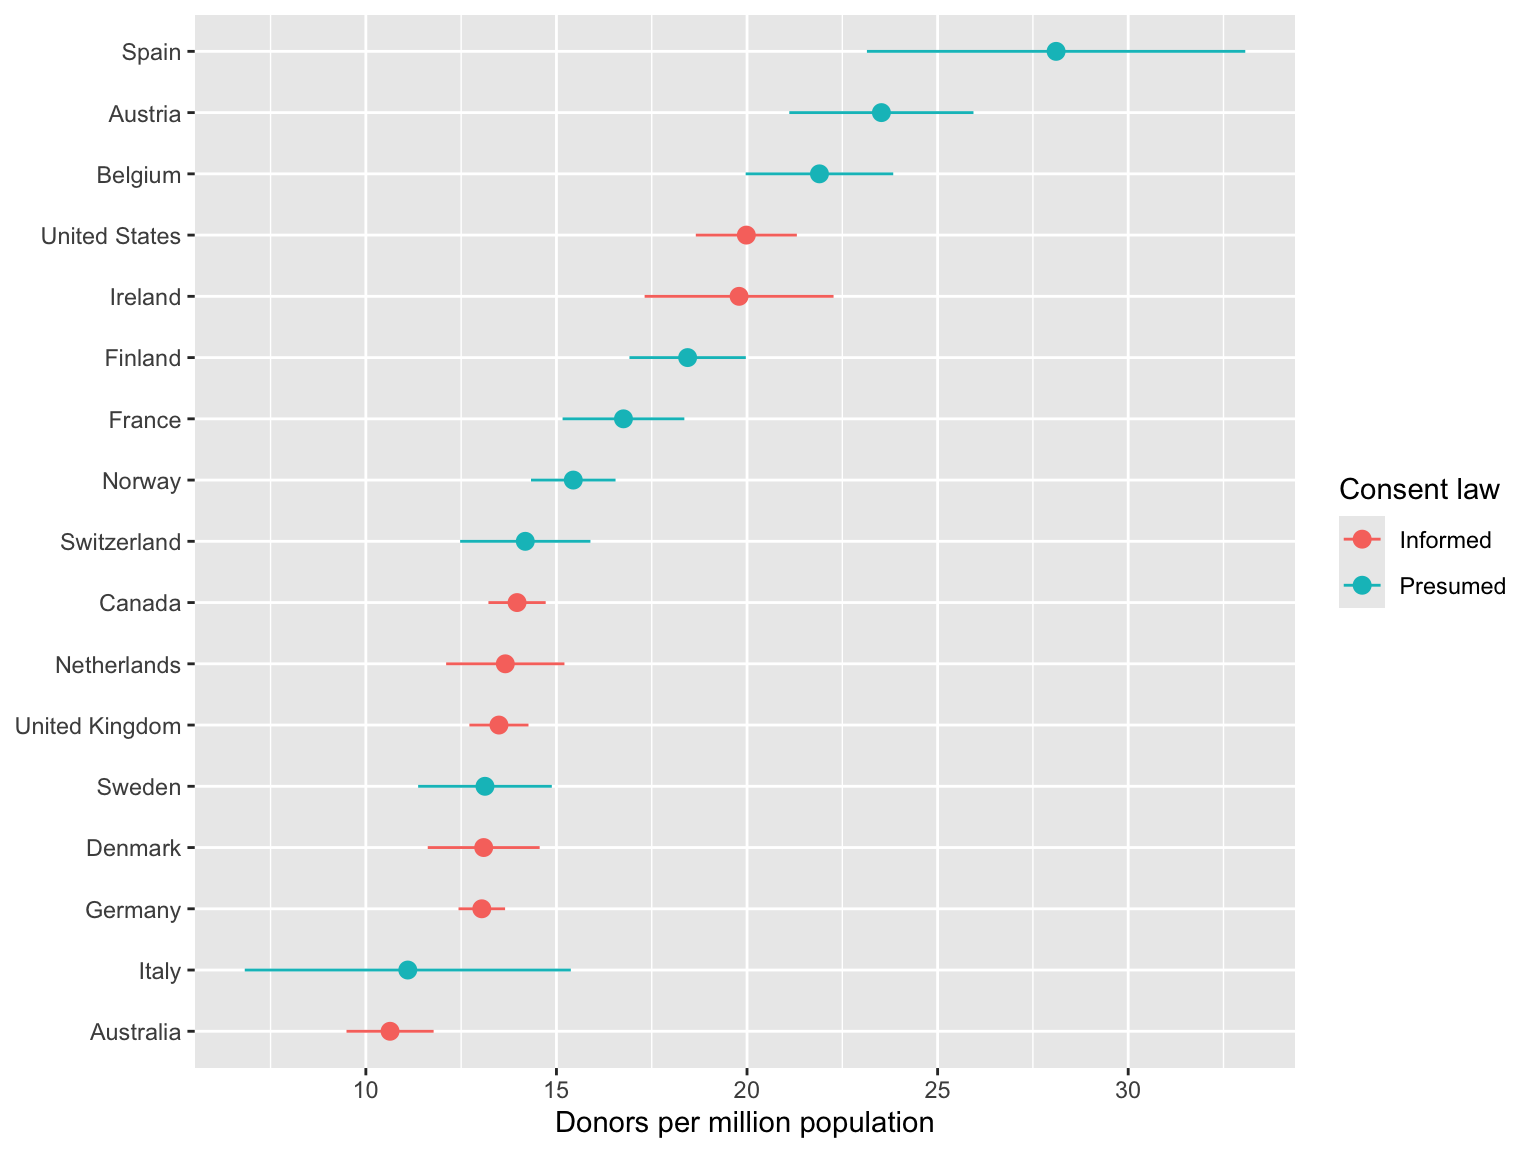
Run it again
Nothing has changed, so nothing needs to be rebuilt.
tar_outdated(script = pipeline_script, store = pipeline_store)character(0)tar_make(script = pipeline_script, store = pipeline_store)✔ skipped pipeline [22ms, 5 skipped]Change one step
Now we edit the pipeline so that the model also includes pubhealth. We rewrite the script with one line changed.
pipeline_script |>
  read_lines() |>
  str_replace(
    fixed("donors ~ gdp + consent_law"),
    "donors ~ gdp + pubhealth + consent_law"
  ) |>
  write_lines(pipeline_script)
targets works out that only the model is affected. The data, the summary, and the plot don’t depend on it, so they stay as they are.
tar_outdated(script = pipeline_script, store = pipeline_store)[1] "donor_model"tar_make(script = pipeline_script, store = pipeline_store)+ donor_model dispatched
✔ donor_model completed [1ms, 22.46 kB]
✔ ended pipeline [162ms, 1 completed, 4 skipped]tar_read(donor_model, store = pipeline_store) |>
broom::tidy()# A tibble: 4 × 5
term estimate std.error statistic p.value
<chr> <dbl> <dbl> <dbl> <dbl>
1 (Intercept) 28.3 2.72 10.4 1.57e-20
2 gdp -0.0000540 0.0000704 -0.767 4.44e- 1
3 pubhealth -1.97 0.356 -5.54 9.80e- 8
4 consent_lawPresumed 3.14 0.641 4.89 2.09e- 6Clean up
fs::dir_delete(pipeline_dir)