── Attaching core tidyverse packages ──────────────────────── tidyverse 2.0.0 ──
✔ dplyr     1.1.4     ✔ readr     2.1.5
✔ forcats   1.0.0     ✔ stringr   1.5.1
✔ ggplot2   3.5.1     ✔ tibble    3.2.1
✔ lubridate 1.9.3     ✔ tidyr     1.3.1
✔ purrr     1.0.2
── Conflicts ────────────────────────────────────────── tidyverse_conflicts() ──
✖ dplyr::filter() masks stats::filter()
✖ dplyr::lag()    masks stats::lag()
ℹ Use the conflicted package (<http://conflicted.r-lib.org/>) to force all conflicts to become errors
here() starts at /Users/kjhealy/Documents/courses/mptc

Loading required package: sysfonts

Loading required package: showtextdbExample 07: Reading and wrangling data
FARS Example
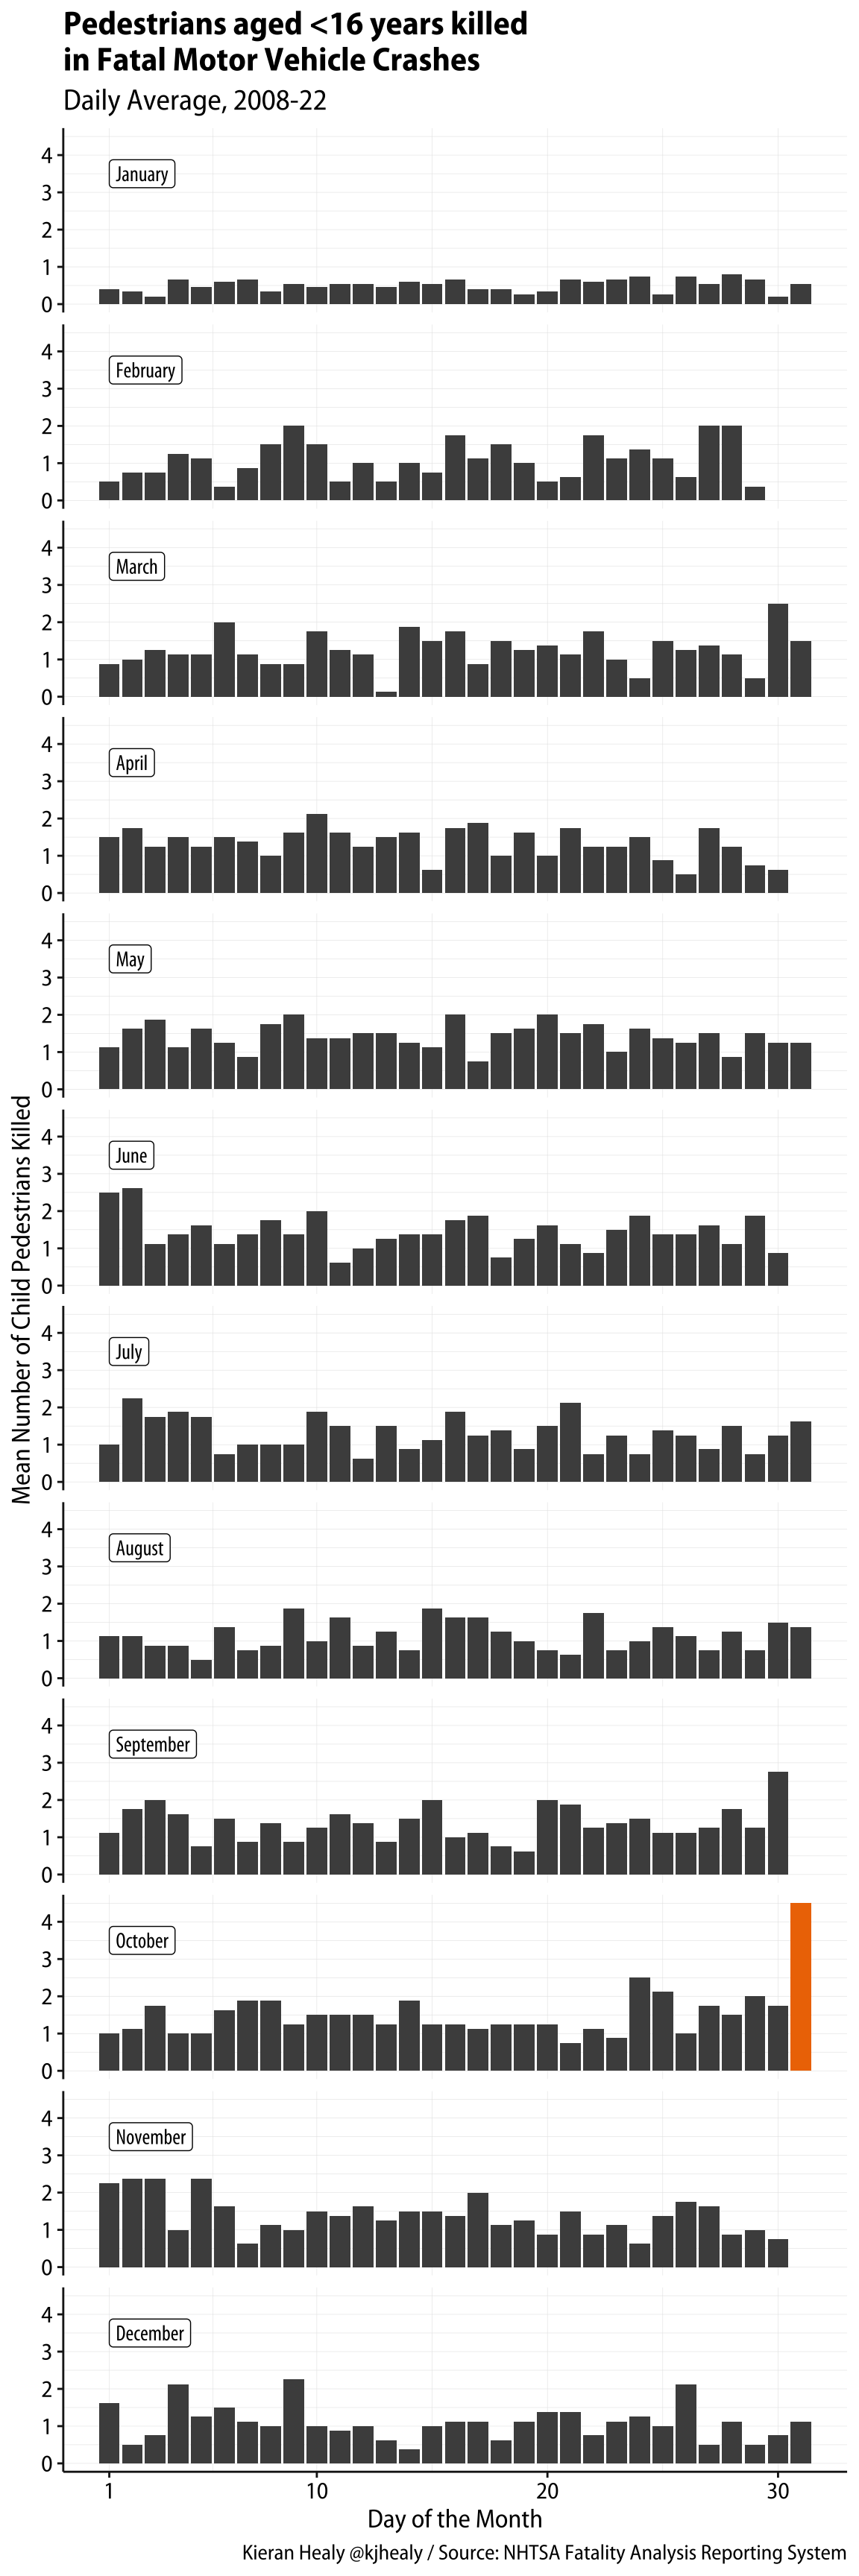
We start with data from the Fatality Analysis Reporting System, which is how the NTSA tracks information about road accidents. Our data file shows counts of pedestrians aged <16 killed in road accidents on each day of the month in the United States from 2009 to 2018.
It arrives, as is very often the case, in a spreadsheet that is not tidy. It looks like this:
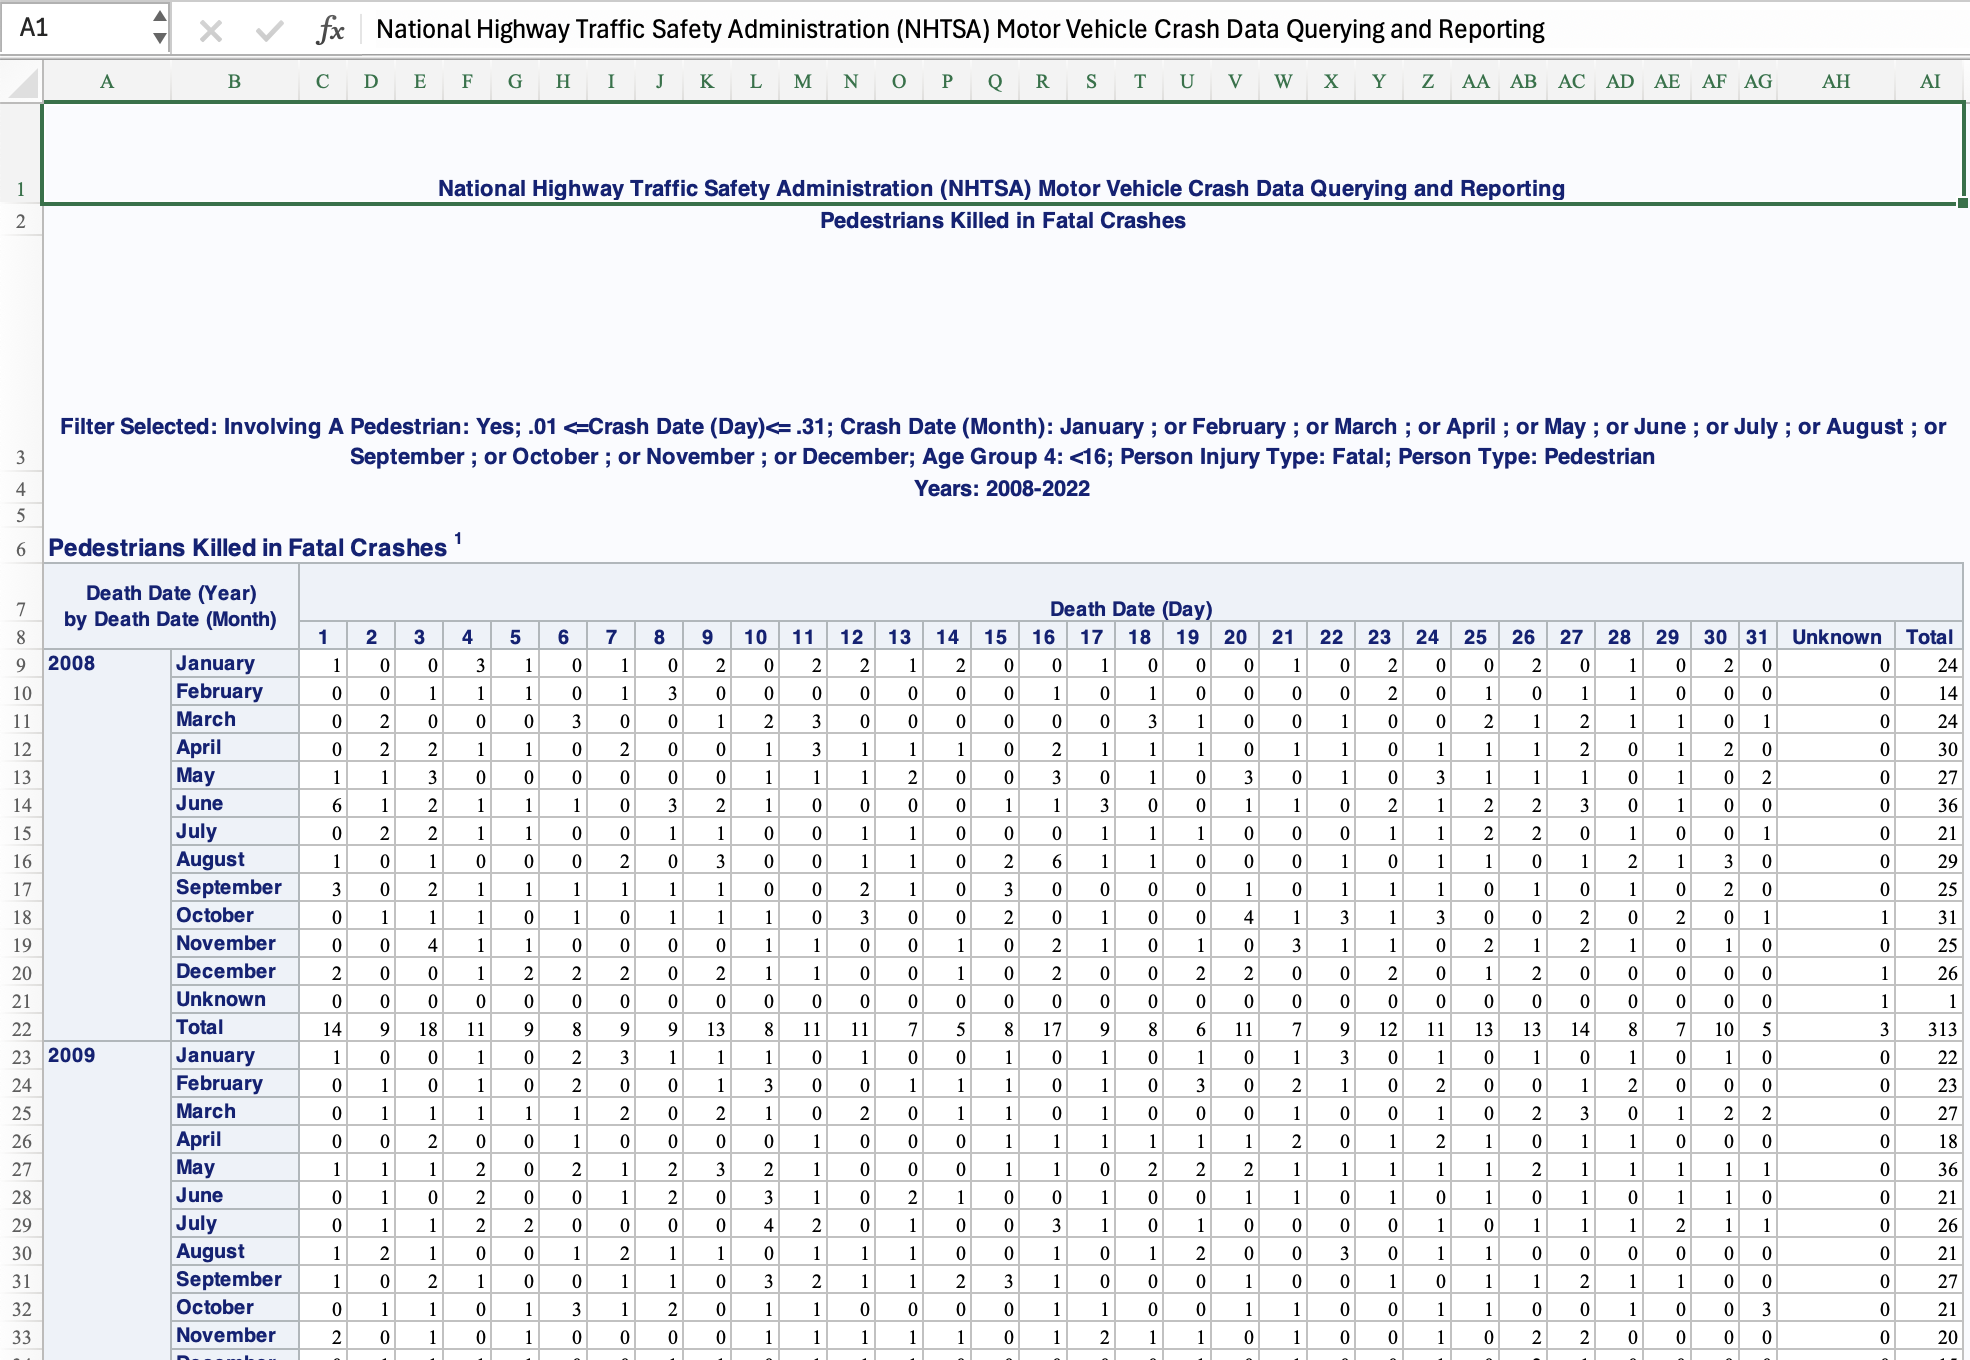
Let’s try to read it in as cleanly as we can, by skipping the metadata at the top.
fars_raw <- readxl::read_xlsx(here("files", "examples", "fars_crash_report.xlsx"),
                              skip = 7)
New names:
• `` -> `...1`
• `` -> `...2`fars_raw |>
print(n=35)# A tibble: 221 × 35
...1 ...2 `1` `2` `3` `4` `5` `6` `7` `8` `9` `10` `11`
<chr> <chr> <dbl> <dbl> <dbl> <dbl> <dbl> <dbl> <dbl> <dbl> <dbl> <dbl> <dbl>
1 2008 Janu… 1 0 0 3 1 0 1 0 2 0 2
2 <NA> Febr… 0 0 1 1 1 0 1 3 0 0 0
3 <NA> March 0 2 0 0 0 3 0 0 1 2 3
4 <NA> April 0 2 2 1 1 0 2 0 0 1 3
5 <NA> May 1 1 3 0 0 0 0 0 0 1 1
6 <NA> June 6 1 2 1 1 1 0 3 2 1 0
7 <NA> July 0 2 2 1 1 0 0 1 1 0 0
8 <NA> Augu… 1 0 1 0 0 0 2 0 3 0 0
9 <NA> Sept… 3 0 2 1 1 1 1 1 1 0 0
10 <NA> Octo… 0 1 1 1 0 1 0 1 1 1 0
11 <NA> Nove… 0 0 4 1 1 0 0 0 0 1 1
12 <NA> Dece… 2 0 0 1 2 2 2 0 2 1 1
13 <NA> Unkn… 0 0 0 0 0 0 0 0 0 0 0
14 <NA> Total 14 9 18 11 9 8 9 9 13 8 11
15 2009 Janu… 1 0 0 1 0 2 3 1 1 1 0
16 <NA> Febr… 0 1 0 1 0 2 0 0 1 3 0
17 <NA> March 0 1 1 1 1 1 2 0 2 1 0
18 <NA> April 0 0 2 0 0 1 0 0 0 0 1
19 <NA> May 1 1 1 2 0 2 1 2 3 2 1
20 <NA> June 0 1 0 2 0 0 1 2 0 3 1
21 <NA> July 0 1 1 2 2 0 0 0 0 4 2
22 <NA> Augu… 1 2 1 0 0 1 2 1 1 0 1
23 <NA> Sept… 1 0 2 1 0 0 1 1 0 3 2
24 <NA> Octo… 0 1 1 0 1 3 1 2 0 1 1
25 <NA> Nove… 2 0 1 0 1 0 0 0 0 1 1
26 <NA> Dece… 0 1 1 1 1 0 0 1 1 0 1
27 <NA> Unkn… 0 0 0 0 0 0 0 0 0 0 0
28 <NA> Total 6 9 11 11 6 12 11 10 9 19 11
29 2010 Janu… 0 1 1 0 0 0 0 1 0 1 0
30 <NA> Febr… 0 0 0 0 2 0 0 0 3 0 1
31 <NA> March 0 0 0 1 1 2 0 1 0 1 1
32 <NA> April 2 5 0 1 1 0 0 3 2 2 1
33 <NA> May 0 0 0 2 2 0 1 0 1 0 0
34 <NA> June 2 2 1 2 1 1 2 4 3 1 0
35 <NA> July 2 2 0 1 0 0 0 0 1 0 3
# ℹ 186 more rows
# ℹ 22 more variables: `12` <dbl>, `13` <dbl>, `14` <dbl>, `15` <dbl>,
# `16` <dbl>, `17` <dbl>, `18` <dbl>, `19` <dbl>, `20` <dbl>, `21` <dbl>,
# `22` <dbl>, `23` <dbl>, `24` <dbl>, `25` <dbl>, `26` <dbl>, `27` <dbl>,
# `28` <dbl>, `29` <dbl>, `30` <dbl>, `31` <dbl>, Unknown <dbl>, Total <dbl>We need to tidy this up. The first two columns don’t have proper names. It’s in wide format and the months aren’t filled in down the columns. We also have a Total value in the day column. We know the column names, so we can supply those manually.
# We haven't seen this kind of "function on either side" way of writing things before; it's handy for this sort of thing.
colnames(fars_raw) <- c("year", "month", 1:31, "unknown", "total")


fars <- fars_raw |>
  # Drop 'Unknown' and 'Total' rows
  select(!all_of(c("unknown", "total"))) |>
  # Make sure there's no leading or trailing whitespace
  mutate(year = str_squish(year),
         month = str_squish(month)) |>
  # Remove 'Unknown' and 'Total' rows
  filter(month %nin% c("Unknown", "Total")) |>
  # Remove 'Redacted', 'Unknown' and 'Total' rows from `year`
  # (This partially overlaps with the 'Unknown' and 'Total' in `month`
  filter(year %nin% c("Redacted", "Unknown", "Total")) |>
  # Remove any lines that are all NAs
  filter(!if_all(everything(), \(x) is.na(x))) |>
  # Fill in the year values downwards
  fill(year) |>
  # Lengthen
  pivot_longer(cols = `1`:`31`, names_to = "day",
               values_to = "n")


fars
# A tibble: 5,921 × 4
year month day n
<chr> <chr> <chr> <dbl>
1 2008 January 1 1
2 2008 January 2 0
3 2008 January 3 0
4 2008 January 4 3
5 2008 January 5 1
6 2008 January 6 0
7 2008 January 7 1
8 2008 January 8 0
9 2008 January 9 2
10 2008 January 10 0
# ℹ 5,911 more rowsWe’re going to make a graph of average patterns by month and day over all available years. So first we aggregate the data by month and day and take the average across years.
# Shortcut use of `.by` here replaces group_by() and returns ungrouped tibble
fars_daily_means <- fars |>
    summarize(mean_n = mean(n, na.rm = TRUE),
            .by = c(month, day))


fars_daily_means
# A tibble: 372 × 3
month day mean_n
<chr> <chr> <dbl>
1 January 1 0.4
2 January 2 0.333
3 January 3 0.2
4 January 4 0.667
5 January 5 0.467
6 January 6 0.6
7 January 7 0.667
8 January 8 0.333
9 January 9 0.533
10 January 10 0.467
# ℹ 362 more rowsFor the purposes of what we’re going to draw, it will make more sense to treat years and months as categorical variables, i.e. as factors, rather than true dates.
dates <- unique(paste(fars$month, fars$day))

dates[1:10]
[1] "January 1" "January 2" "January 3" "January 4" "January 5"
[6] "January 6" "January 7" "January 8" "January 9" "January 10"fars_daily_means <- fars_daily_means |>
mutate(
# Ordered categorical var of months
month_fac = factor(month,
levels = unique(fars$month),
ordered = TRUE),
# Convert from character to integer
day = as.integer(day),
# Ordered factor of month-days
day_fac = factor(paste(month, day),
levels = dates,
ordered = TRUE),
# Dummy variable: is it Halloween today?
flag = ifelse(month == "October" & day == 31, TRUE, FALSE),
# Shortcut .by again
.by = c(month, day)) |>
# Order for convenience
arrange(day_fac)
fars_daily_means# A tibble: 372 × 6
month day mean_n month_fac day_fac flag
<chr> <int> <dbl> <ord> <ord> <lgl>
1 January 1 0.4 January January 1 FALSE
2 January 2 0.333 January January 2 FALSE
3 January 3 0.2 January January 3 FALSE
4 January 4 0.667 January January 4 FALSE
5 January 5 0.467 January January 5 FALSE
6 January 6 0.6 January January 6 FALSE
7 January 7 0.667 January January 7 FALSE
8 January 8 0.333 January January 8 FALSE
9 January 9 0.533 January January 9 FALSE
10 January 10 0.467 January January 10 FALSE
# ℹ 362 more rowsNow we can draw a plot. This one is generated from the code here but there’s a theme setting that’s not shown that makes the fonts a bit nicer.
# Make a mini dataset of facet labels
month_labs <- fars_daily_means |>
  distinct(month) |>
  mutate(x = 1L, y = 3.5,
         month_fac = factor(month, ordered = TRUE))

fars_daily_means |>
  ggplot(mapping = aes(x = day, y = mean_n, fill = flag)) +
    geom_col() +
    scale_fill_manual(values = c("gray30", "darkorange2")) +
    scale_x_continuous(breaks = c(1, 10, 20, 30)) +
    geom_label(data = month_labs,
                              mapping = aes(x = x, y = y, label = month),
                              inherit.aes = FALSE, hjust = 0,
               family = "Myriad Pro Condensed") +
    guides(fill = "none") +
    facet_wrap(~ month_fac, ncol = 1) +
    labs(x = "Day of the Month",
         y = "Mean Number of Child Pedestrians Killed",
         title = "Pedestrians aged <16 years killed\nin Fatal Motor Vehicle Crashes",
         subtitle = "Daily Average, 2008-22",
         caption = "Kieran Healy @kjhealy / Source: NHTSA Fatality Analysis Reporting System") +
  theme(strip.text = element_blank())
Warning: Combining variables of class <ordered> and <ordered> was deprecated in ggplot2
3.4.0.
ℹ Please ensure your variables are compatible before plotting (location:
`combine_vars()`)Warning: Combining variables of class <ordered> and <factor> was deprecated in ggplot2
3.4.0.
ℹ Please ensure your variables are compatible before plotting (location:
`combine_vars()`)